Logging & Plotting
WebATM can record simulation data with BlueSky data logs (CRELOG) and give
you a quick look at the results — all from the browser, no spreadsheet needed.
Prerequisites
You must be connected to a BlueSky server, and the BlueSky base
directory must be configured (Settings → BlueSky base path) so WebATM can
list the output/ folder. The Integrated Build does
both automatically.
Create a data log
Open the Output Log tab in the bottom-right console pane and click + Create Log:
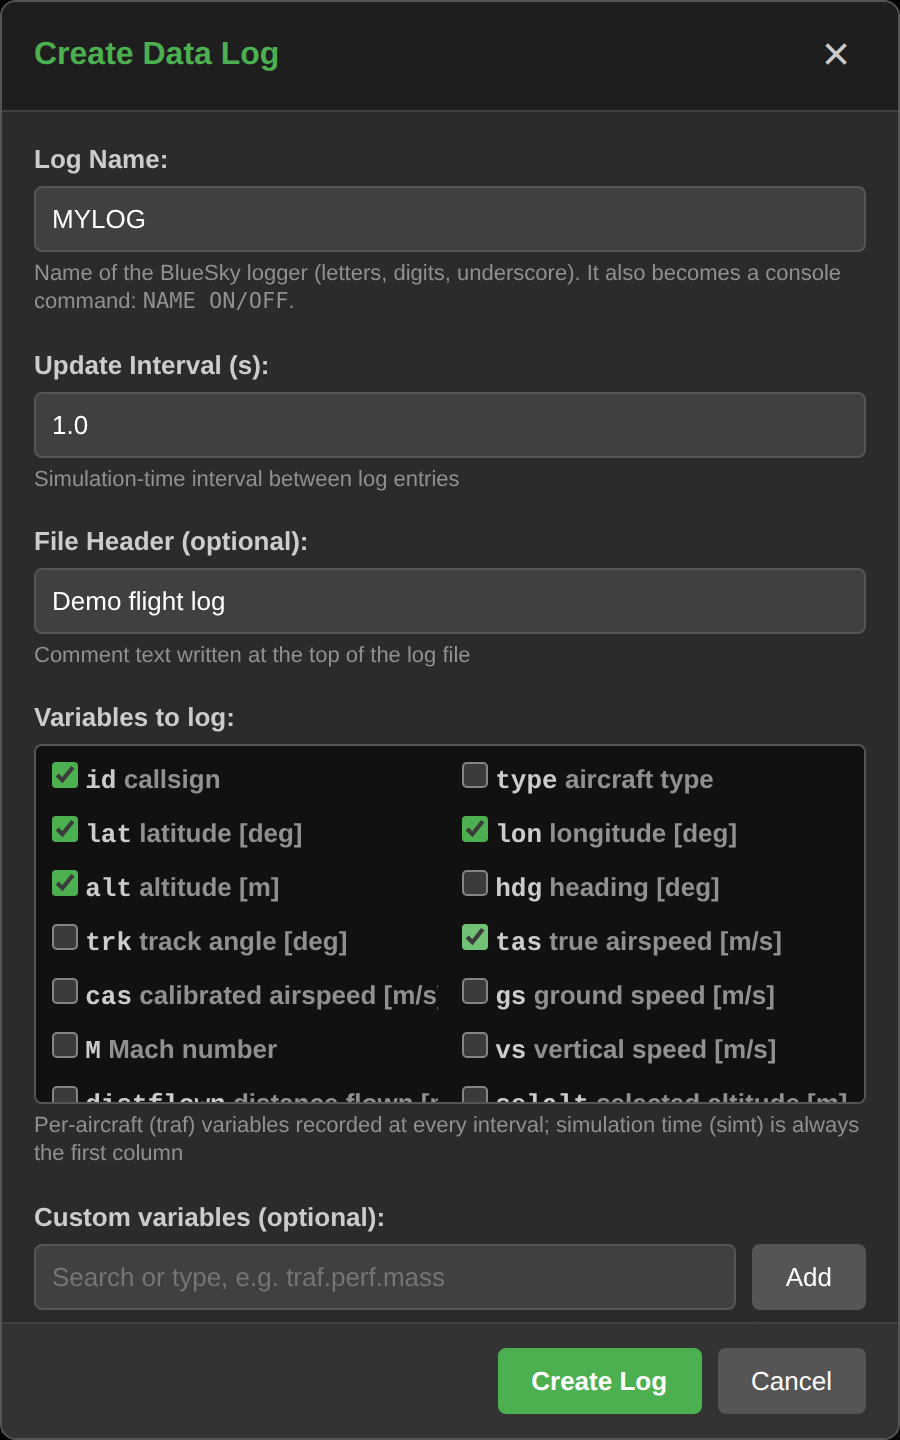
- Log Name — name of the BlueSky logger; it also becomes a console command
(
MYLOG ON/MYLOG OFF). - Update Interval — simulation-time seconds between log entries.
- Variables to log — tick the per-aircraft (
traf.*) variables to record; simulation time (simt) is always the first column. Other variables (e.g.traf.perf.mass) can be added under Custom variables, with live search and validation against the running simulation.
The dialog shows a live preview of the BlueSky commands it will send — the equivalent of typing this in the command console:
With Start logging immediately ticked, the log starts as soon as you click Create Log, and a quick-control chip appears above the file list to stop or restart it at any time.
Browse log files
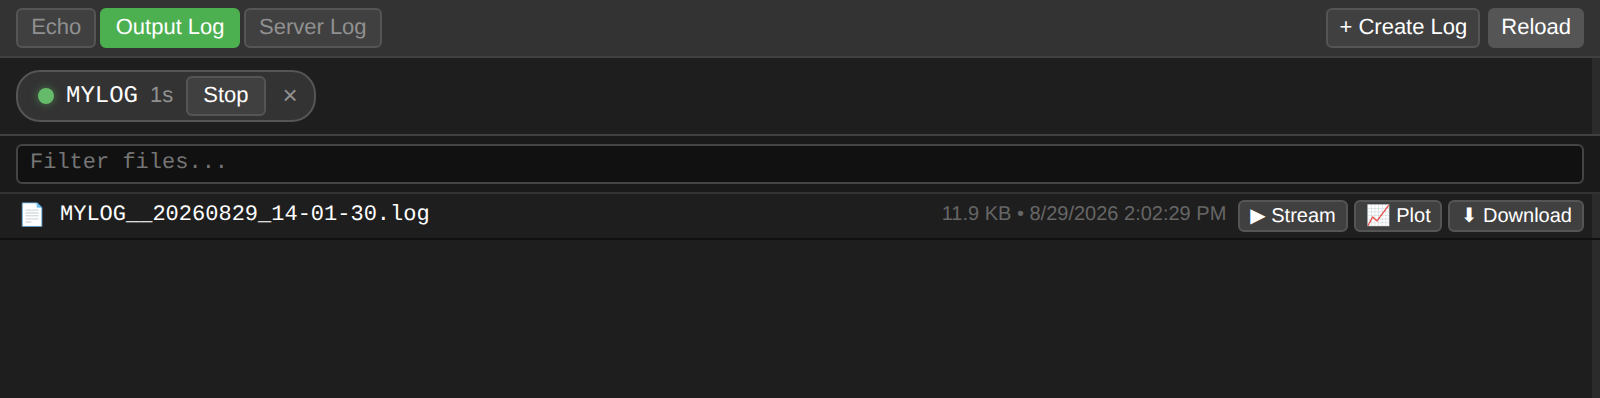
The Output Log tab lists everything in BlueSky's output/ directory. Each log
gets a timestamped file you can Stream (follow live), Plot, or
Download:
Plot a log
Click 📈 Plot on any .log or .csv file. The plot modal parses the file
and groups rows per aircraft — click a legend chip to toggle a series
(shift-click to solo it), and use Reload to re-fetch a log that is still
growing.
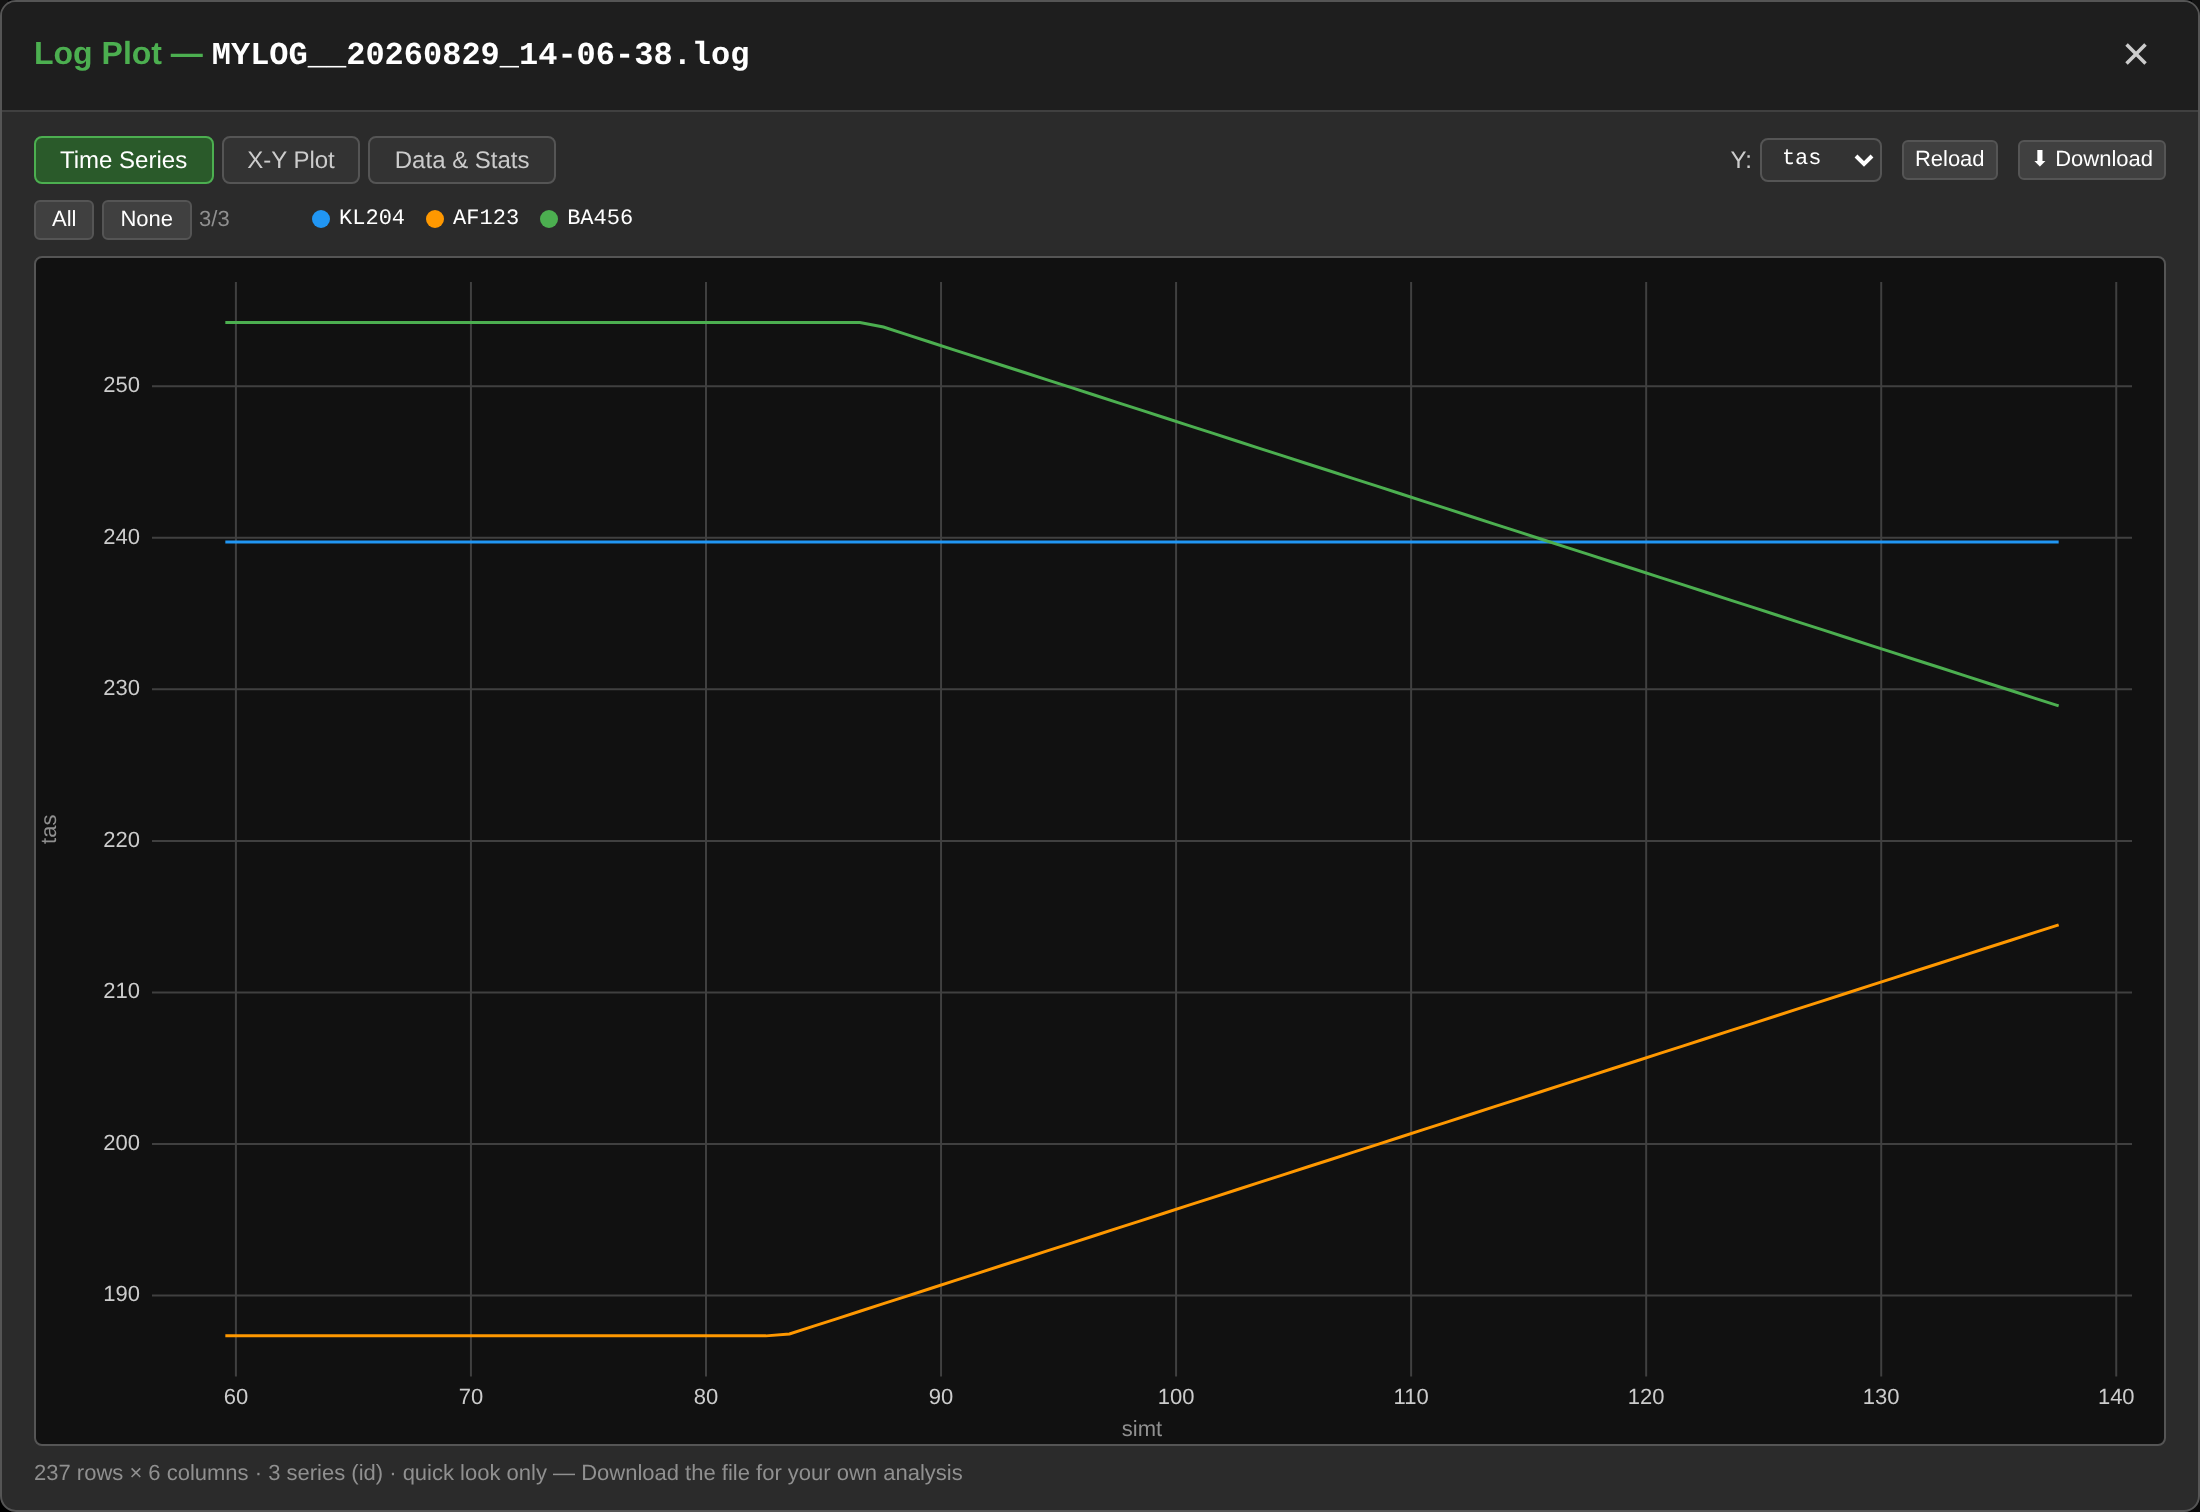
Time Series plots any numeric column against simulation time — here the true airspeed of three aircraft, one accelerating and one decelerating:
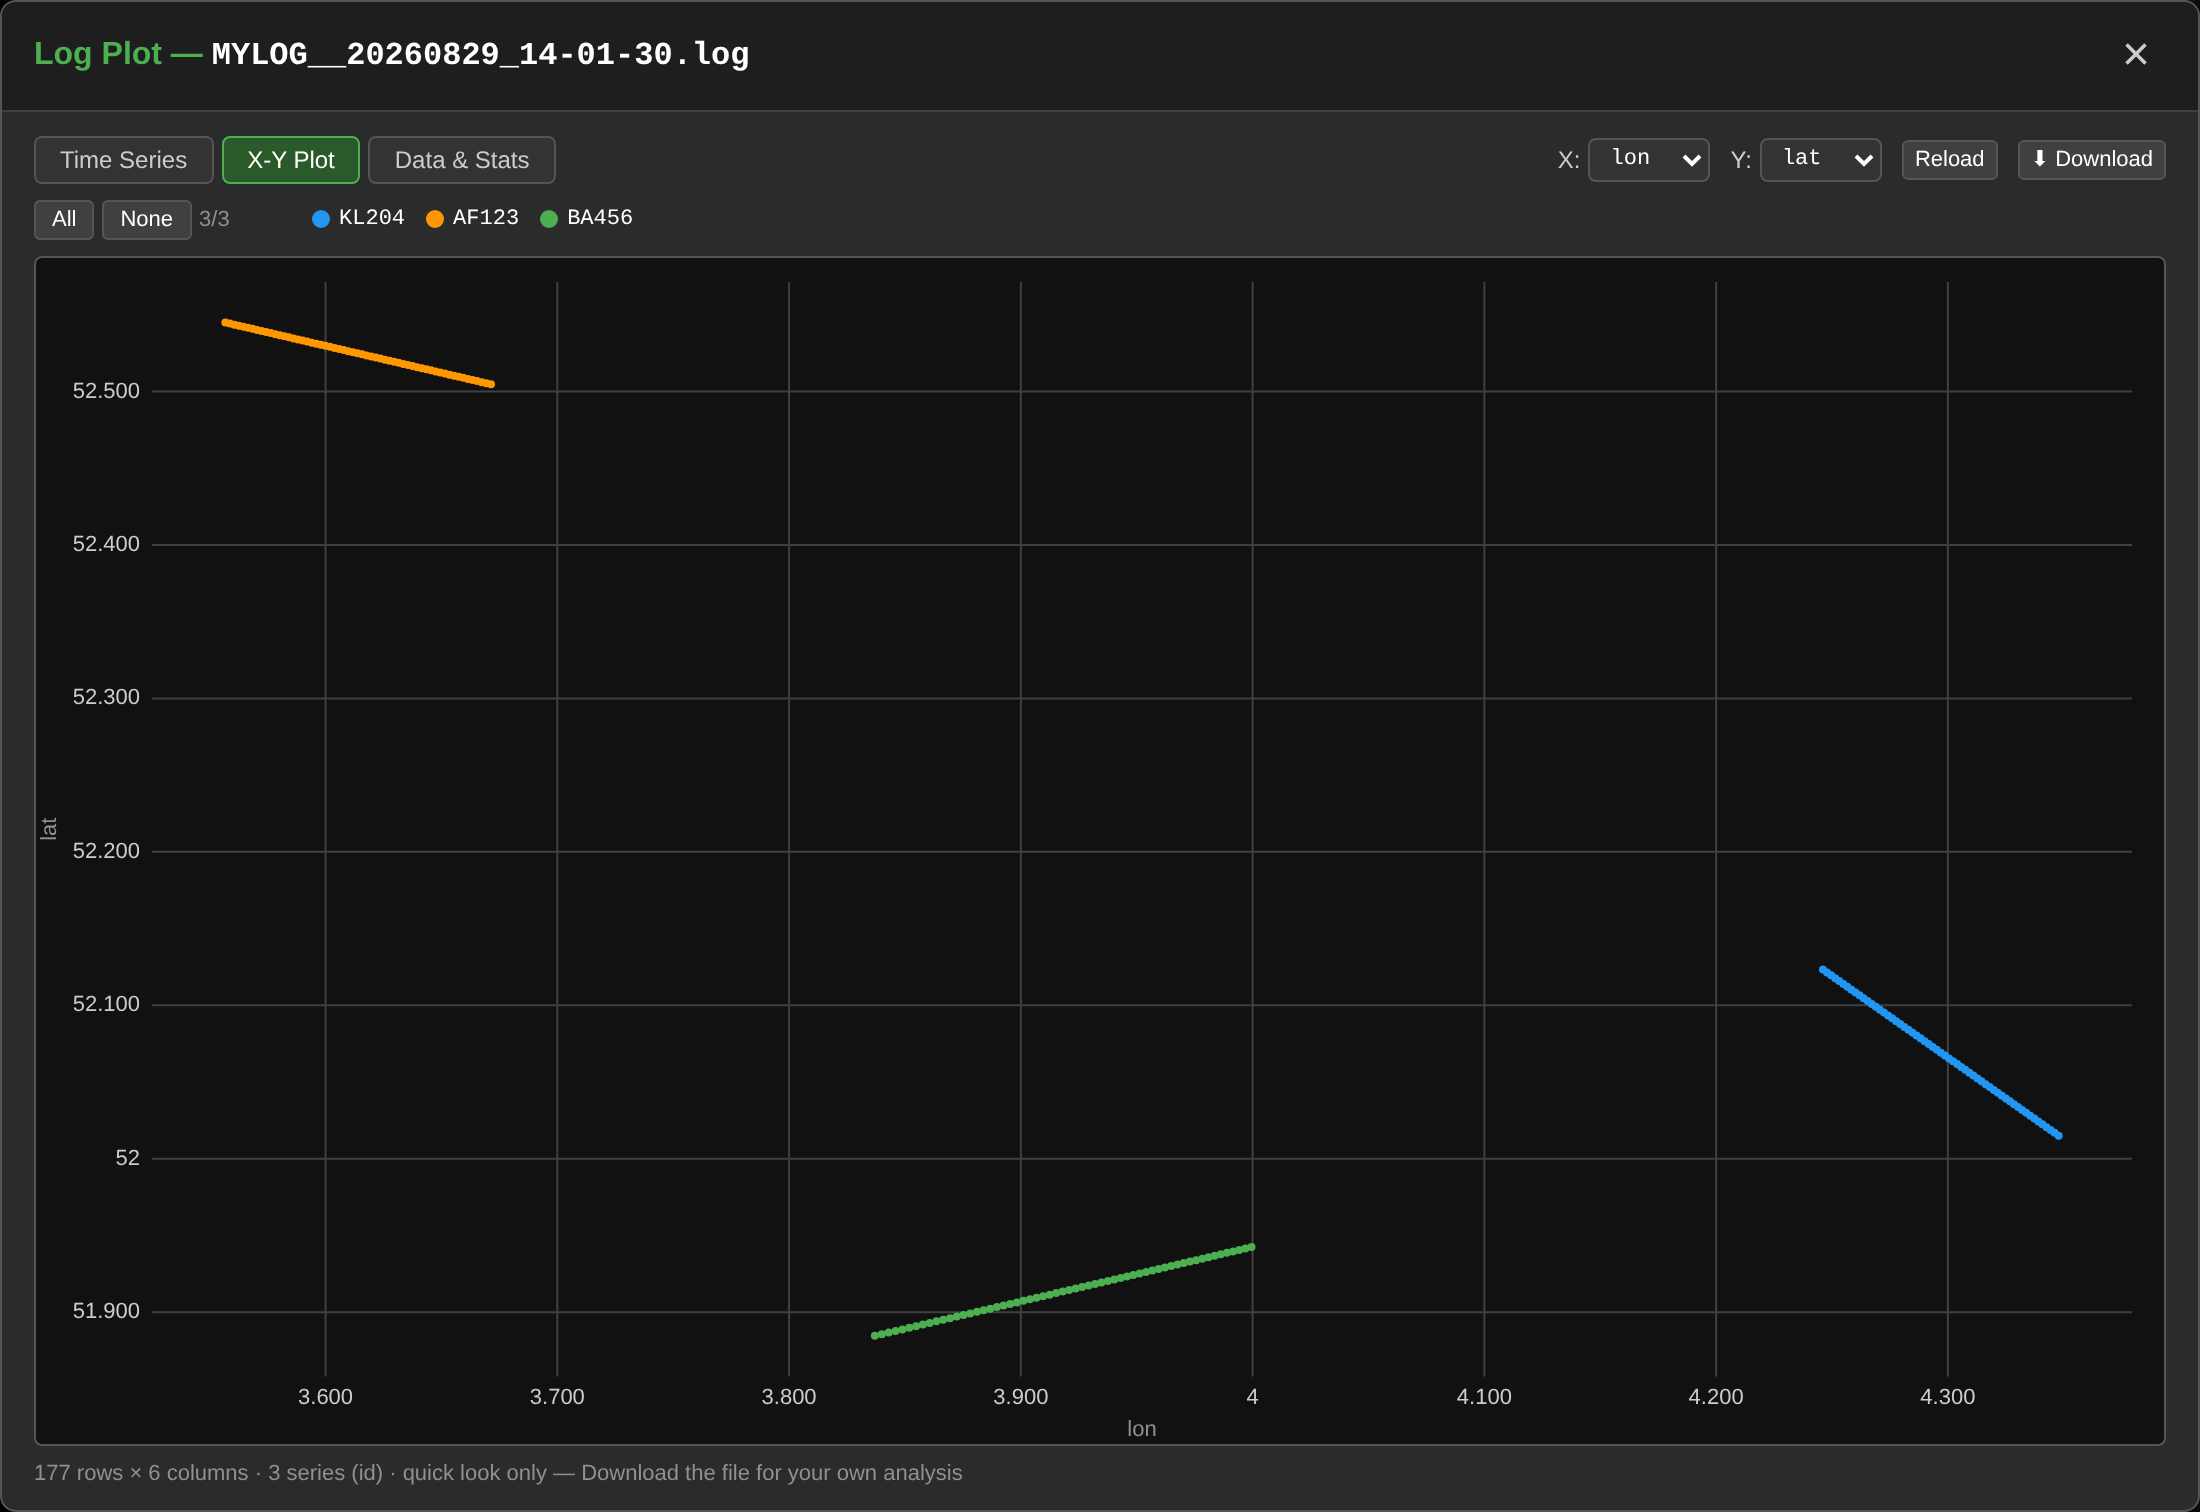
X-Y Plot plots any two columns against each other; with lat/lon logged
it defaults to a ground track:
Data & Stats shows per-column statistics and the last rows of the file. The plots are a quick look, not an analysis tool — use Download to take the raw file into another tool.
Not every log is plottable
The plot views expect periodic data logs like the ones created above — numeric columns sampled at a fixed interval. BlueSky can also write other kinds of logs, e.g. event-based logs created with stack commands or by plugins (conflict logs, flight-statistics logs, …). Those still appear in the file list and can be downloaded, but the modal will tell you they can't be plotted — download them and analyze them with your own tools.